
Reference
OpenTelemetry and Prometheus
Export traces with OpenTelemetry, scrape Prometheus metrics, and read the logs of a deployed Worker.
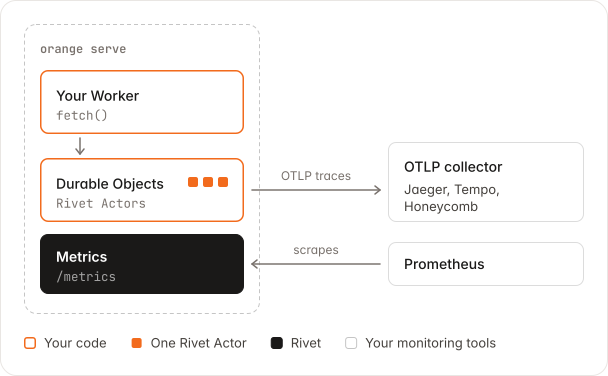
Each Durable Object runs as a Rivet Actor, so Rivet’s traces, metrics, and logs cover your objects. You turn them on with environment variables, and your code does not change.
Quickstart
You need a Rivet Cloud cluster and an OTLP collector, such as Jaeger, Tempo, or Honeycomb.
-
Send traces to your collector
orange deploy \ --var OTEL_SERVICE_NAME:my-app \ --var OTEL_EXPORTER_OTLP_TRACES_ENDPOINT:https://collector.example.com/v1/traces -
Find an object's spans
Each request and RPC call to a Durable Object is one span. Its
rivet.actor.keyis the object’s ID. -
Open metrics and logs
On Rivet Cloud these need no setup. The Rivet dashboard shows your cluster’s metrics, and its Logs page shows your Worker’s output.
Try it locally
orange dev reads the same variables from your shell.
export OTEL_SERVICE_NAME=my-app
export OTEL_EXPORTER_OTLP_TRACES_ENDPOINT=https://collector.example.com/v1/traces
orange dev
Self-host
Pass the same variables to the container. Set RIVETKIT_METRICS_PORT to serve Prometheus
metrics, and scrape them from a sidecar in the same pod.
docker run \
  -e OTEL_SERVICE_NAME=my-app \
  -e OTEL_EXPORTER_OTLP_TRACES_ENDPOINT=https://collector.example.com/v1/traces \
  -e RIVETKIT_METRICS_PORT=9464 \
  -e RIVET_ENDPOINT=... my-worker
Learn more
- OpenTelemetry: span names, sampling, and application spans
- Performance monitoring: PromQL for actors and SQLite
- Logging: log levels and formats
AI context Spans, metrics, and log output in detail
Written for LLMs and coding agents: every edge case, measurement, and known deviation. You do not need it to use the feature.
Traces
- With an OTLP endpoint set, RivetKit exports a span for each Durable Object request and RPC call, with the SQLite work inside it. The Worker’s own handlers get no spans.
- Each span carries
rivet.actor.name, which is the class in kebab case and a short hash, such asgreeter-5c8cd02c, andrivet.actor.key, which is the object’s ID. --varalso puts the variable in the Worker’senv. See Variables and secrets.- If the collector needs an API key in
OTEL_EXPORTER_OTLP_HEADERS, pass it with--secrets-file, not--var.
Metrics
RivetKit serves Prometheus metrics at http://127.0.0.1:$RIVETKIT_METRICS_PORT/metrics.
- Rivet Cloud sets
RIVETKIT_METRICS_PORTon each runner, collects the metrics, and shows them in the Rivet dashboard.orange deployrefuses to set it with--var. - Self-hosted: the endpoint listens on
127.0.0.1only, sodocker run -pdoes not expose it. Scrape it from the same network namespace, such as a sidecar in the same Kubernetes pod. orange devserves no metrics.- With several Workers, only the first Worker’s runtime serves metrics, so they cover that Worker’s objects only.
| Metric | What it shows |
|---|---|
rivet_rivetkit_actor_active_count | Awake actors, by actor_name |
rivet_rivetkit_actor_http_requests_active | Requests and RPC calls in progress |
rivet_rivetkit_actor_inbox_depth | Work waiting to run |
Logs
orange devprints each request and your Worker’sconsoleoutput.orange serveprints theconsoleoutput and RivetKit’s warnings and errors.- Self-hosted, read the container’s output.
- Set
RIVET_LOG_LEVEL=infoto add RivetKit’s info logs.